

- 10,787 hospital admissions linked to dog attacks were recorded in England in 2024/25.
- 10,776 hospital admissions were recorded in 2023/24, showing that serious injuries requiring hospital treatment have remained broadly stable.
- Northumbria Police recorded the highest year-on-year increase among the areas analysed, rising from 648 incidents in 2024 to 1,067 in 2025 (+64.7%).
- Lincolnshire recorded the highest rate of incidents per 100,000 people in 2025, with 94 recorded incidents per 100,000 residents.
- The Metropolitan Police recorded the highest total number of incidents in 2025, with 2,530 recorded offences, although its rate per 100,000 people was among the lowest due to its large population.
- Dog Attacks in the UK at a Glance
- Are Dog Attacks Increasing in the UK?
- Dog Attacks by Police Force Area
- Full UK Dog Attack Statistics by Police Force
- Where Have Dog Attacks Increased the Most?
- What Do Dog Attack Statistics Mean for Owners?
- How Can Dog Owners Improve Safety at Home?
- How Dog-G8 Helps Create Safer Spaces for Dogs
- FAQs
Dog attacks remain a huge concern for owners, communities and, unsurprisingly, delivery workers across the UK.
But what do the latest figures actually tell us?
To better understand the scale of the issue, Dog-G8 has analysed the latest available police-recorded dog attack data alongside NHS hospital admission figures to understand where incidents are happening, how the trends are changing - and, most importantly: “What does this mean for dog owners?”
Sources used:
- NHS England hospital admission data
- Police-recorded dangerous dog offence data
- Office for National Statistics population estimates
Dog Attacks in the UK at a Glance
The latest police and NHS data provide insight into the scale of dog-related incidents across the UK, including the number of reported incidents, hospital admissions and areas experiencing the biggest changes.
10,787 people were admitted to hospital following dog attacks in 2024/25, according to NHS hospital admission data.
This was almost unchanged from the previous year, when 10,776 admissions were recorded (a 0.1% increase year-on-year).
Police-recorded data shows a different picture, with more than 29,000 recorded incidents across the police force areas analysed between 2024 and 2025.
The overall number of recorded incidents increased by approximately 2.9% year-on-year, although the change varied significantly depending on location.
But while these figures show the scale of the issue, it doesn’t quite paint the full picture regarding dog-related incidents in the UK.
Are Dog Attacks Increasing in the UK?
Well, it depends on which bit of the data you look at.
NHS hospital admissions suggest that the number of people requiring hospital treatment following dog attacks has remained relatively stable, with only a 0.1% increase between 2023/24 and 2024/25.
Police-recorded data varies a little more. Across the police force areas in our analysis, recorded incidents increased overall between 2024 and 2025, although changes differed significantly depending on location.
So this doesn’t necessarily mean that dog attacks are becoming more severe (or dogs are more dangerous, in fact), but rather that:
- Police data reflects reported incidents and offences recorded by individual forces.
- NHS data reflects injuries serious enough to require hospital admission.
Understanding both helps create a more accurate picture of dog safety in the UK.
Dog Attacks by Police Force Area
Dog attacks can vary considerably depending on where people live. So to compare areas fairly, we’ve calculated recorded incidents per 100,000 people using police data alongside population estimates.
You can see the full report on our interactive map below.
UK dog attack statistics visualisation by Kieran Smith
Police Force Areas with the Highest Recorded Incident Rates in 2025
| Rank | Police Force | Recorded Incidents per 100,000 People |
|---|---|---|
| 1 | Lincolnshire Police | 94 |
| 2 | Northamptonshire Police | 93 |
| 3 | Durham Constabulary | 88 |
| 4 | Gwent Police | 85 |
| 5 | Cleveland Police | 84 |
Looking at rates rather than total numbers is important. Larger areas naturally tend to record more incidents because they have larger populations.
For example, the Metropolitan Police recorded the highest total number of incidents in 2025 with 2,530 recorded offences, but its rate per 100,000 people was much lower due to the size of its population.
Full UK Dog Attack Statistics by Police Force
The table below provides the full breakdown of recorded incidents by police force area.
On mobile, scroll across the table to view all columns.
| Rank | Police Force | Population (2024) | Dog Attacks (2024) | Per 100,000 (2024) | Dog Attacks (2025) | Per 100,000 (2025) | Change (2024–2025) |
|---|---|---|---|---|---|---|---|
| 1 | Northumbria Police | 1,509,809 | 648 | 43 | 1,067 | 71 | 64.66% |
| 2 | Durham Constabulary | 650,500 | 351 | 54 | 572 | 88 | 62.96% |
| 3 | Cleveland Police | 600,369 | 363 | 60 | 507 | 84 | 39.67% |
| 4 | Dorset Police | 798,914 | 413 | 52 | 571 | 71 | 38.26% |
| 5 | Warwickshire Police | 632,207 | 403 | 64 | 500 | 79 | 24.07% |
| 6 | Staffordshire Police | 1,177,578 | 517 | 44 | 639 | 54 | 23.60% |
| 7 | Lincolnshire Police | 789,502 | 636 | 81 | 742 | 94 | 16.67% |
| 8 | Norfolk Constabulary | 940,359 | 358 | 38 | 415 | 44 | 15.92% |
| 9 | Cumbria Constabulary | 510,680 | 377 | 74 | 437 | 86 | 15.92% |
| 10 | Wiltshire Police | 767,575 | 426 | 55 | 477 | 62 | 11.97% |
| 11 | Hertfordshire Constabulary | 1,236,191 | 448 | 36 | 499 | 40 | 11.38% |
| 12 | Cambridgeshire Constabulary | 933,972 | 398 | 43 | 435 | 47 | 9.30% |
| 13 | Nottinghamshire Police | 1,188,090 | 494 | 42 | 532 | 45 | 7.69% |
| 14 | Suffolk Constabulary | 786,231 | 358 | 46 | 385 | 49 | 7.54% |
| 15 | North Yorkshire Police | 844,571 | 417 | 49 | 443 | 52 | 6.24% |
| 16 | West Mercia Police | 1,340,814 | 781 | 58 | 825 | 62 | 5.63% |
| 17 | Kent Police | 1,931,684 | 1,195 | 62 | 1,261 | 65 | 5.52% |
| 18 | Lancashire Constabulary | 1,601,645 | 1,265 | 79 | 1,333 | 83 | 5.38% |
| 19 | Dyfed-Powys Police | 524,219 | 299 | 57 | 315 | 60 | 5.35% |
| 20 | Surrey Police | 1,248,649 | 722 | 58 | 757 | 61 | 4.85% |
| 21 | West Midlands Police | 3,036,605 | 1,198 | 39 | 1,372 | 45 | 14.51% |
| 22 | Devon & Cornwall Police | 1,840,161 | 1,224 | 67 | 1,265 | 69 | 3.35% |
| 23 | Northamptonshire Police | 813,682 | 736 | 90 | 759 | 93 | 3.13% |
| 24 | Greater Manchester Police | 3,009,664 | 1,639 | 54 | 1,678 | 56 | 2.38% |
| 25 | Leicestershire Police | 1,175,364 | 586 | 50 | 597 | 51 | 1.88% |
| 26 | South Yorkshire Police | 1,430,623 | 1,087 | 76 | 1,107 | 77 | 1.84% |
| 27 | Derbyshire Constabulary | 1,096,526 | 744 | 68 | 756 | 69 | 1.61% |
| 28 | Bedfordshire Police | 749,943 | 267 | 36 | 271 | 36 | 1.50% |
| 29 | Merseyside Police | 1,475,541 | 1,219 | 83 | 1,237 | 84 | 1.48% |
| 30 | North Wales Police | 697,115 | 535 | 77 | 517 | 74 | -3.36% |
| 31 | Humberside Police | 962,532 | 600 | 62 | 575 | 60 | -4.17% |
| 32 | Gwent Police | 601,686 | 535 | 89 | 511 | 85 | -4.49% |
| 33 | West Yorkshire Police | 2,435,236 | 1,157 | 48 | 1,105 | 45 | -4.49% |
| 34 | South Wales Police | 1,363,561 | 683 | 50 | 633 | 46 | -7.32% |
| 35 | Metropolitan Police Service | 9,074,625 | 2,747 | 30 | 2,530 | 28 | -7.90% |
| 36 | Avon and Somerset Constabulary | 1,813,665 | 922 | 51 | 844 | 47 | -8.46% |
| 37 | Essex Police | 1,929,610 | 1,664 | 86 | 874 | 45 | -47.48% |
Where Have Dog Attacks Increased the Most?
Some police force areas recorded significantly higher numbers of incidents compared with the previous year. The largest increases in our dataset were:
| Police Force | Incidents (2024) | Incidents (2025) | Percent Change |
|---|---|---|---|
| Northumbria Police | 648 | 1,067 | +64.7% |
| Durham Constabulary | 351 | 572 | +63.0% |
| Cleveland Police | 363 | 507 | +39.7% |
Changes in recorded figures do not always mean behaviour or risk has changed by the same amount.
Reporting patterns, enforcement activity and local circumstances can all influence police-recorded statistics.
What Do Dog Attack Statistics Mean for Owners?
Essentially, these stats help find patterns - but they don't explain every incident.
Dog attacks boil down to many different circumstances, including:
- The environment where the incident occurred
- The dog's behaviour and training
- The actions of people involved
- Whether risks were identified and managed beforehand
For dog owners, the important question is not only "how many incidents happen?" but also: What practical steps can reduce avoidable risks?
How Can Dog Owners Improve Safety at Home?
Statistics can show us where incidents are happening, but they cannot explain every individual situation.
In my experience, dog safety often comes down to managing everyday moments: an open front door, a visitor arriving, a delivery being dropped off, or a moment of distraction.
One of the most common concerns we hear from Dog-G8 customers is dogs escaping through open doors.
A dog running out unexpectedly can put them at risk of traffic, getting lost or being stolen.
Dog gates are not a replacement for training, but they can provide an extra layer of safety by helping owners create secure boundaries at home.
How Dog-G8 Helps Create Safer Spaces for Dogs
Everyday dog safety is often about preventing problems before they happen.
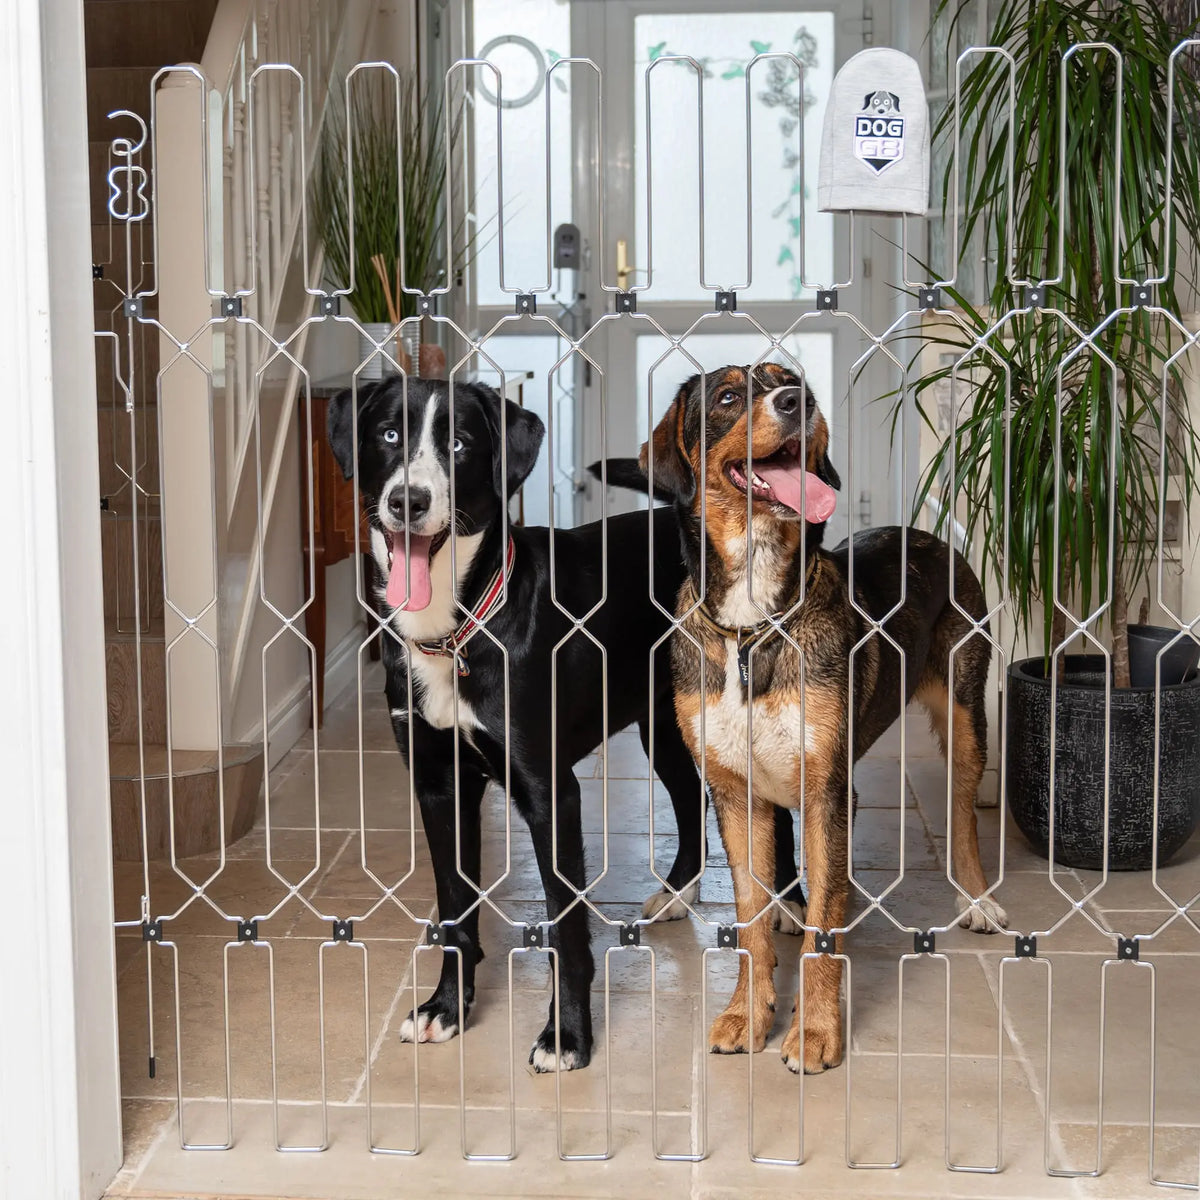
Dog-G8 was designed to help owners manage one of the most common challenges we hear about: dogs escaping through open front doors.
Our gates create a secure barrier that helps give owners more control during everyday moments like answering the door, welcoming visitors or accepting deliveries.
While no product replaces training and responsible ownership, creating safer boundaries at home can give both dogs and owners greater peace of mind.
Find out how Dog-G8 can help create a safer space for your dog.
FAQs
How Many Dog Attacks Happen in the UK Each Year?
NHS data recorded 10,787 hospital admissions linked to dog attacks in England in 2024/25, compared with 10,776 the previous year.
Are Dog Attacks Increasing in the UK?
The picture is mixed. Hospital admissions increased by just 0.1%, while police-recorded incidents across the areas analysed increased by approximately 2.9%.
Which UK Area Has the Highest Rate of Dog Attacks?
Lincolnshire recorded the highest rate in 2025, with 94 incidents per 100,000 people among the areas analysed.
How Can I Stop My Dog Escaping Through the Front Door?
Training, careful door management and physical barriers can all help prevent unexpected escapes.
Read our guide to preventing front-door escapes.